We are a shoe-string operation. Unfortunately no BigOilfunding! Help expose the hoax.

email: info@australianclimatesceptics.com

Donations: Contact above email address.

All Scientists are Sceptics ~Professor Bob Carter

“Climate is and always has been variable. The only constant about climate is change; it changes continually.” ~Professor Tim Patterson

Perhaps the most frustrating aspect of the science of climate change is the lack of any real substance in attempts to justify the hypothesis ~Professor Stewart Franks
Showing posts with label Anthony Cox. Show all posts

Monday, 21 July 2014

If Lewandowsky is a climate scientist then so am I.


Anthony Cox

Shag on Rock
Apologies to Josh
You can’t keep Lew down and he has just co-authored a paper proving the temperature is rising. Lew’s idea is that statements about the temperature pause, including by the IPCC, simply don’t take into account natural variation which in a cooling phase will suppress the AGW warming.

This idea has been around for yonks. 

Cohenite looked at the idea in 2008. Basically the technique is detrend for all natural factors by removing the estimate of their temperature effect and what is left should be the pure AGW signal.

Lots of people have done this; the original paper was Keenlyside et al in 2008. Easterling and Wehner in 2009 extended this concept to the usual grotesque AGW exaggeration. The previous Keenlyside et al effort predicted masking of underlying AGW due to SST driven natural variation. Unfortunately, when the ENSO is removed from temperature trends there is no post 2000 underlying AGW. Easterling and Wehner revisit this trainwreck of an idea to prove that future cooling will still have underlying AGW. Their null hypothesis [NH] really settles the matter. The NH is that there will be an “equal percentage of statistically significant positive and negative trends” [p6]. This is high order virtual reality; the concept of the 100 year flood explains why. Pacific Decadal Oscillation [PDO] climate phases have greater probability of floods during a negative phase during which time [about 30 years] there may be several 1 in 100 year floods. During the positive, El Nino dominated PDO phase there will most likely be no 1 in 100 year flood.

The same principle applies to temperature. Positive PDOs will have increasing temperature trends and vice-versa for negative PDOs. The paper doesn’t consider ENSO at all apart from an admission that it is not modelled well [p6]. Table 1 shows more positive temperature trends in the 20thC. This was due to positive PDO dominance not, as the paper claims, AGW.

The recent definitive paper on this idea by Foster and Rahmstrof in 2011 supposedly extracted a pure AGW signal after removing all natural factors. F and R are a lot of fun.They removed all the natural factors that may have contributed to temperature increase and were left with a range of 0.014 to 0.018 K yr−1 as the pure AGW forcing. They calculated a rate which was constant from 1979. This should have set the alarm bells ringing for a start since CO2 was increasing exponentially during this period; if the dominant forcing factor was increasing the AGW temperature effect should also have been increasing. But it seems that their methodology was also flawed. By including a linear trend for warming in their analysis as an independent variable, Foster and Rahmstorf have demonstrated that global warming is well correlated with global warming. Furthermore Bob Tisdale shows Forster and Ramstorf were wrong to consider ENSO as an exogenous factor and to exclude it from their analysis.

Just when you think this nonsense is over along comes Lew. Lew says this:
Some studies and the IPCC Fifth Assessment Report suggest that the recent 15-year period (1998–2012) provides evidence that models are overestimating current temperature evolution. Such comparisons are not evidence against model trends because they represent only one realization where the decadal natural variability component of the model climate is generally not in phase with observations. We present a more appropriate test of models where only those models with natural variability (represented by El Niño/Southern Oscillation) largely in phase with observations are selected from multi-model ensembles for comparison with observations. These tests show that climate models have provided good estimates of 15-year trends, including for recent periods and for Pacific spatial trend patterns.
Credit where credit is due. This is smart. Lew doesn’t remove natural variation he selects models which have natural variation in phase with AGW. AGW is now proved because there is temperature increase when you factor in natural variation.

But seriously this is a dog’s breakfast. What is he saying; that AGW is only to be measured when there is natural warm phase such as in the +ve PDO:


That is AGW is only to be shown when the world is heating through a warm natural phase as shown in the red lines? Is this because natural variation in the cool phase eliminates any AGW signal as shown in the blue lines? And surely in the warm phases of natural variation wouldn’t the warming be especially high if AGW and natural variation are working together?

Desperation and absurdity is now the stock in trade of alarmists like Lewandowsky.

A real scientific paper about Ocean Heat Content [OHC] has just been published by leading oceanographic experts Wunsch and Heimbach. They show that the deep oceans are cooling and that, logically, heat in the ocean probably comes from the bottom of the ocean due to geothermal activity not from the surface down as AGW theory insists in the most ridiculous way [see here and here]. Figure 18 from Wunsch and Heimbach sums up the nonsense about OHC:


That’s it folks; AGW demolished and Lew left like a Shag on a rock.

Monday, 14 July 2014

More Heat about Ocean Heat - another nail in the AGW coffin

Anthony Cox

I have previously written about the fact that the heat in the ocean isn’t there. A Facebook commentator produced some excellent graphs based on the ARGO data which showed NO heat accumulation at any level in the world’s oceans. This lack of warming contradicts completely  (Anthropogenic Global Warming) AGW theory as put forward by such AGW stalwarts as Trenberth and England. It also has Hansen scrambling for weird and whacky explanations.

So it is plain in the ARGO era that the oceans are not warming and this contradicts AGW.

In my articles I noted that NODC graphs were shown in joules which allowed a steeper slope compared to a temperature trend. Mischievously I suggested an ulterior motive for this. Alarmism.

Another blogger has taken me to task. Rob Ryan has defended the NODC graphs and pointed out that they do indeed have temperature graphs. Indeed they do:


Thanks Rob. By way of comparison here is the same graph in joules:


Well to me the trend slope in the joules graph looks steeper and more alarming than the temperature graph. But Rob doesn’t like OHC as a measure of the energy; it is poor terminology according to Rob. Hey Rob, don’t blame me, argue with NODC and indeed AGW in general; they’re the ones using and relying on it.

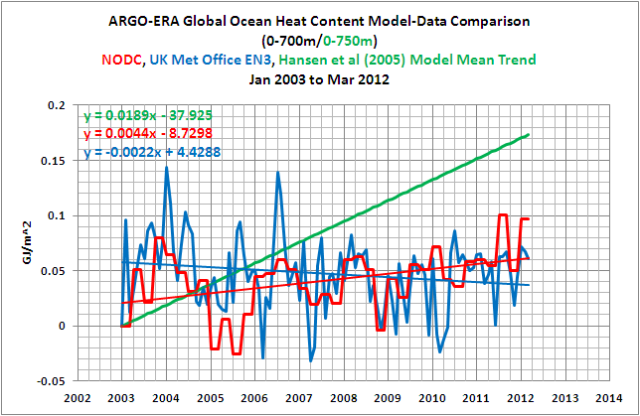
What really is poor is the notion that by any measure the oceans are heating. The estimable Bob Tisdale does a comparison of all OHC measures and produces this graph:


Plainly Hansen’s model on behalf of AGW is off with the pixies while the MET and the NODC show the opposite trend!

A couple of things about this. 

Firstly the ARGO data is adjusted before it is presented. Obviously NODC and the MET adjust it differently. In fact in another post Bob Tisdale examines the NODC adjustment procedure:


At the 700 meters range NODC have increased the trend by 19%. The NODC adjustments increase the trend at 2000 meters by 36%!

Secondly the ARGO data, even though it is the best we have ever had, is vastly insufficient. Willis Eschenbach notes:

  • The sampling of the oceans is by no means as uniform as I had expected. Part of the ocean is under sampled, sometimes badly so, compared to other areas. Half of the global ocean has been sampled less than 20 times per 10,000 sq. km, and 14% has never been sampled by Argo floats at all.
  • Even when we look at just the area from 60°N/S, half the ocean has been sampled less than 24 times per 10,000 sq. km, and 8% is unsampled.
  •  The area of the El Nino phenomenon is a critical area for the regulation of planetary heat loss. Oceanic heat content in this area can change quite rapidly. However, parts of it are woefully undersampled.
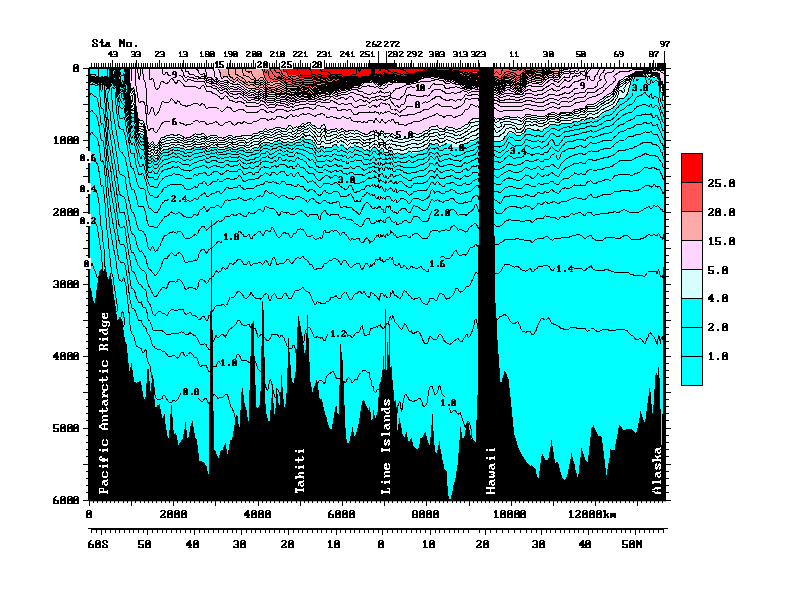
  • Finally, the older Argo floats sample either down to 1,000 metres, and intermittently go to 1,500 metres depth. The newer ones go down to 1800 metres. Which is quite deep, about a mile down. But the estimates of oceanic heat storage include the whole ocean. Figure 3 shows a pair of transects from Antarctica (on the left) to Hawaii, and then Hawaii to Alaska on the right, to give some sense of scale.

Figure 3 (Figure 10 from cited source.) North/South Pacific transect at 150°W.  ORIGINAL CAPTION: Vertical section of potential temperature (°C) along 150°W from data collected in 1991-1993 as part of the World Ocean Circulation Experiment. Data north of Hawaii were collected in 1984 (Talley et al., 1991). Potential temperature is the temperature a parcel of water would have if moved to the sea surface with no change in heat content, and is lower than measured temperature since temperature increases when water is compressed due to the high pressure in the ocean. Source and Image
The Argo floats operate mostly in the warmer area up top of Figure 3, above the lower thermocline (light blue). Average depth in this entire transect is much deeper than that, about 5,000 metres. So the Argo floats are measuring less than a quarter of the water in this part of the Pacific basin. Makes the whole question of oceanic heat content kinda iffy.

Kinda iffy is a vast understatement! The ARGO floats don’t even go to 2000 meters and yet we have temperature profiles at that depth.

The only reasonable conclusion is that based on the best data from ARGO the oceans are not warming, whether you are considering joules or temperature.


Thanks again Rob; by my reckoning that is another nail in the AGW coffin.